01.07.25
Widgets
When tables in Ninox are no longer sufficient: time for widgets


Widgets are no longer just visual embellishments. When used correctly, they can make your Ninox database noticeably more productive – by simplifying processes, speeding up decisions, and reducing sources of error.
Here are a few concrete examples of how this looks in practice:
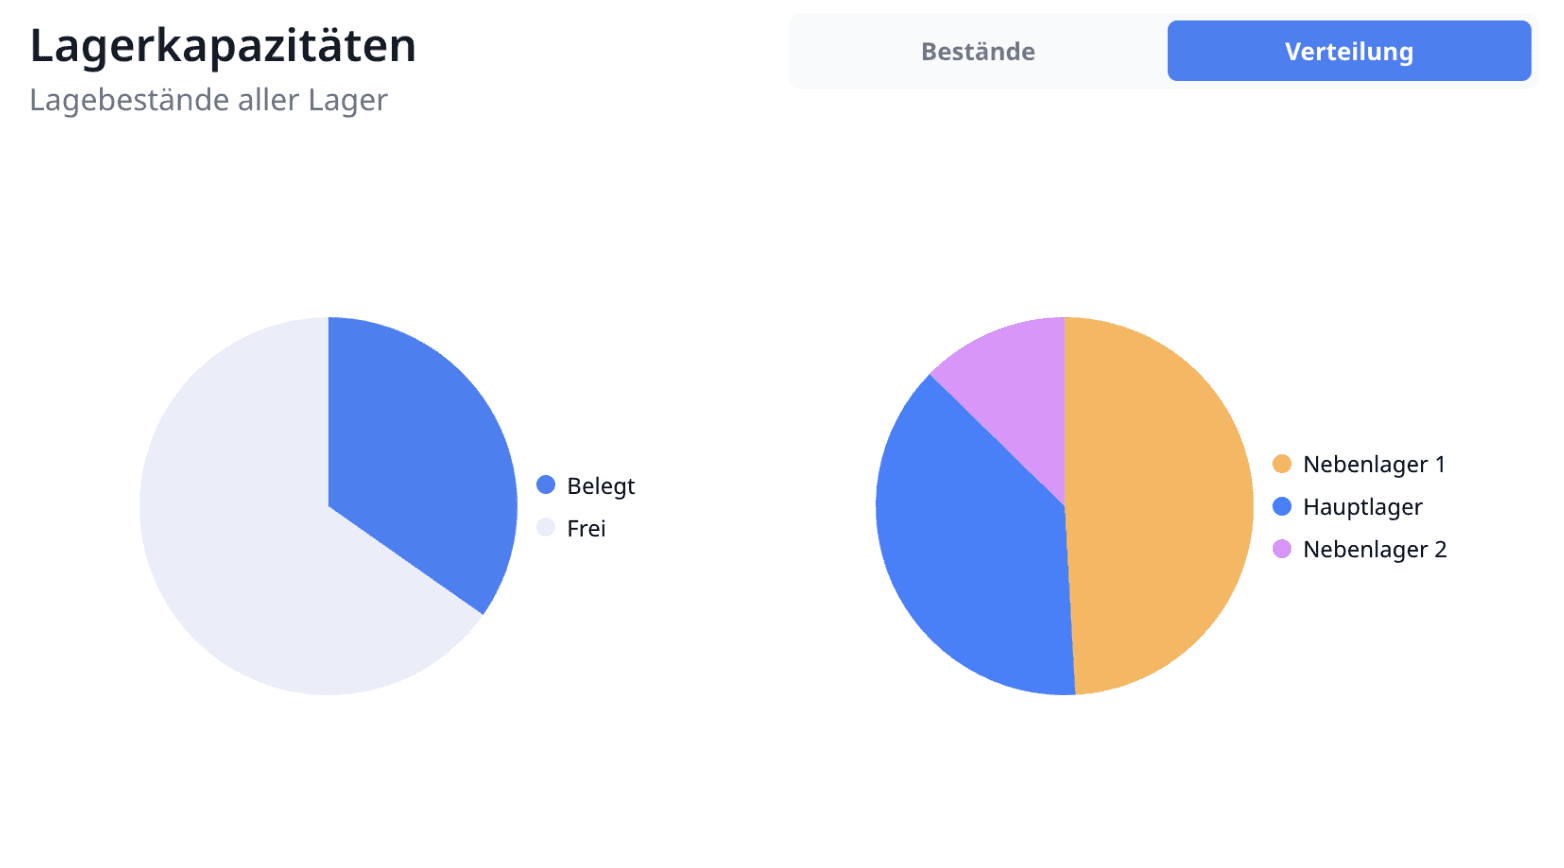
1. Overview that gets straight to the point
A well-placed pie chart, a calendar with color-coded markings, or a compact progressbar can achieve more than any table view. Especially with many data sets, visualization helps to quickly identify where issues are – or what has already been done. In a warehouse dashboard, a simple pie chart shows at a glance how products are distributed across different warehouses – and how much capacity is still available. This visual representation can be grasped much more quickly than piecing together the corresponding numbers from a table.
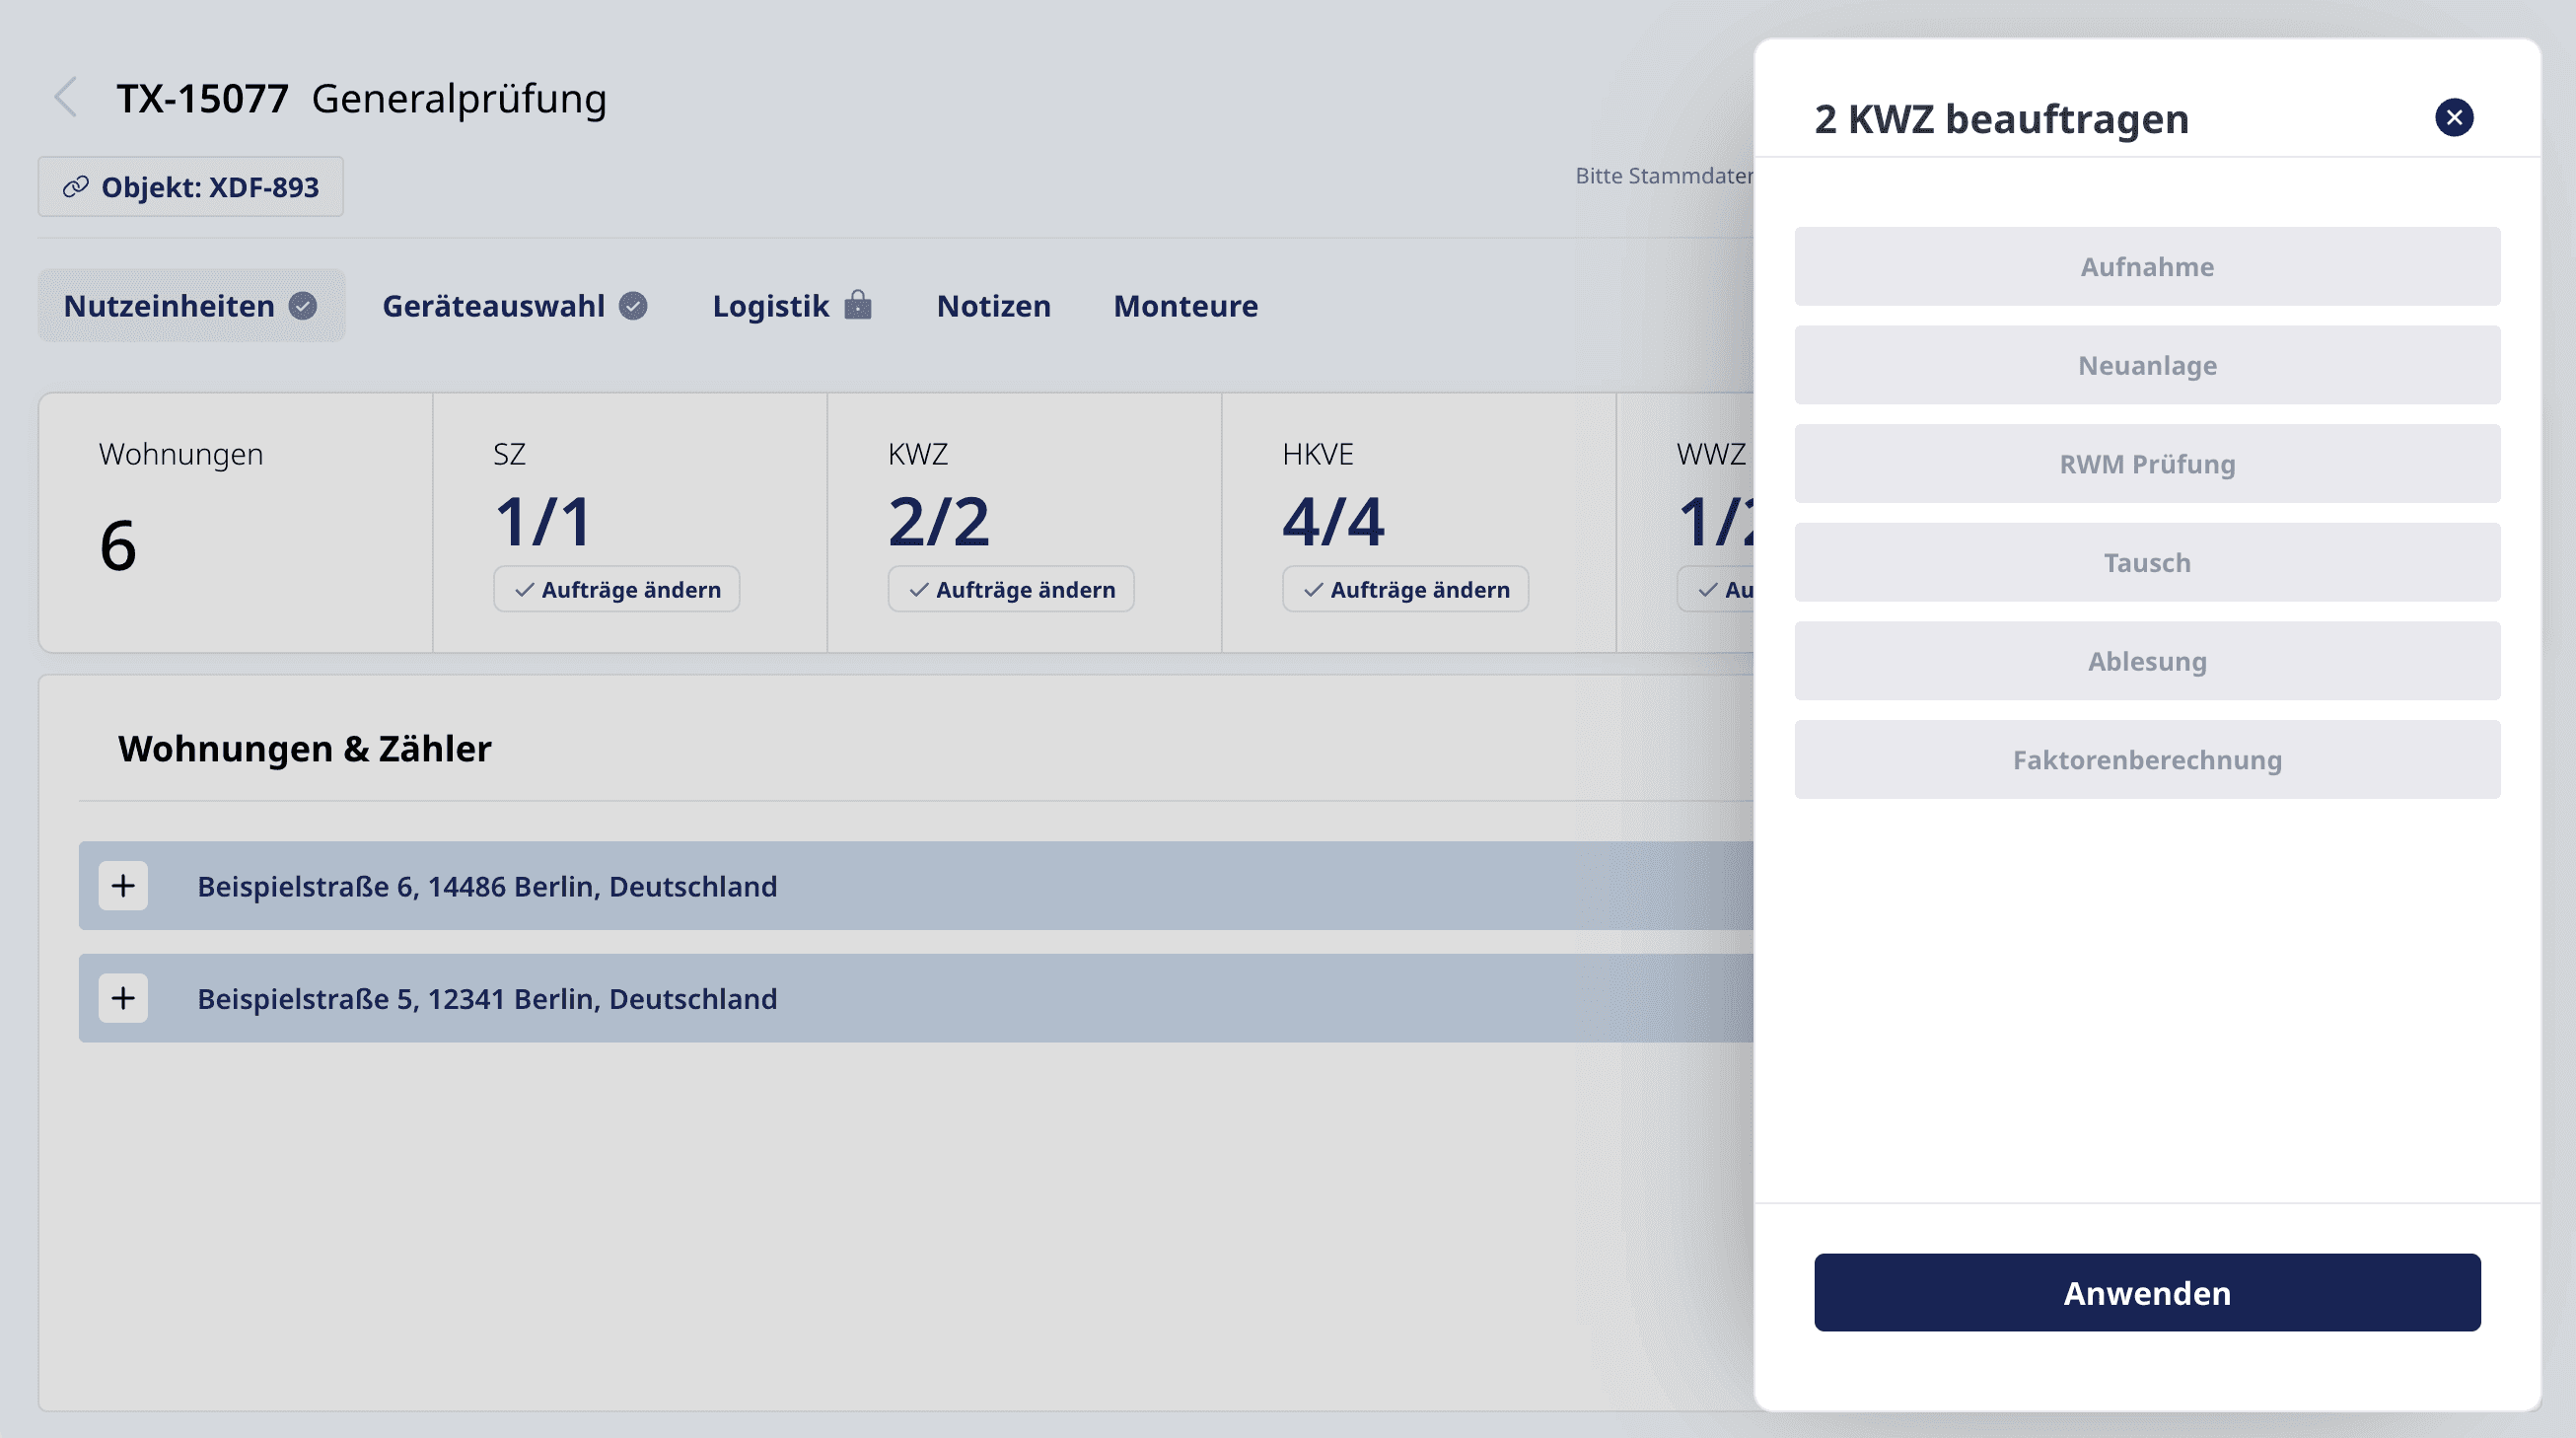
2. Intuitive instead of cumbersome: actions directly where they are needed
Widgets allow multiple actions to be bundled directly on one interface – exactly where they are needed. For example, a service employee can perform several steps in sequence or edit mass data that would otherwise require multiple clicks in nested sub-tables.
This saves time, reduces friction – and makes work noticeably smoother.
3. Fewer errors because context becomes visible
Standard forms often only show input fields. Widgets, on the other hand, allow for contextual surfaces: A color-highlighted warning for missing mandatory fields, a counter widget that points to low stock levels, or an interactive planning module that only allows selectable slots.
In this interface for skilled trades applications, information is presented that would be difficult to grasp in table form:
The status of meter access (“Access to the device”) is large, clearly colored, and marked with an icon.
On the left are the individual meters, including status, visualized in a progress display – quickly recognizable instead of hidden.
The types of meters are also color-highlighted (WMZ, HKVE, etc.), so it is clear at a glance what type of device is involved.
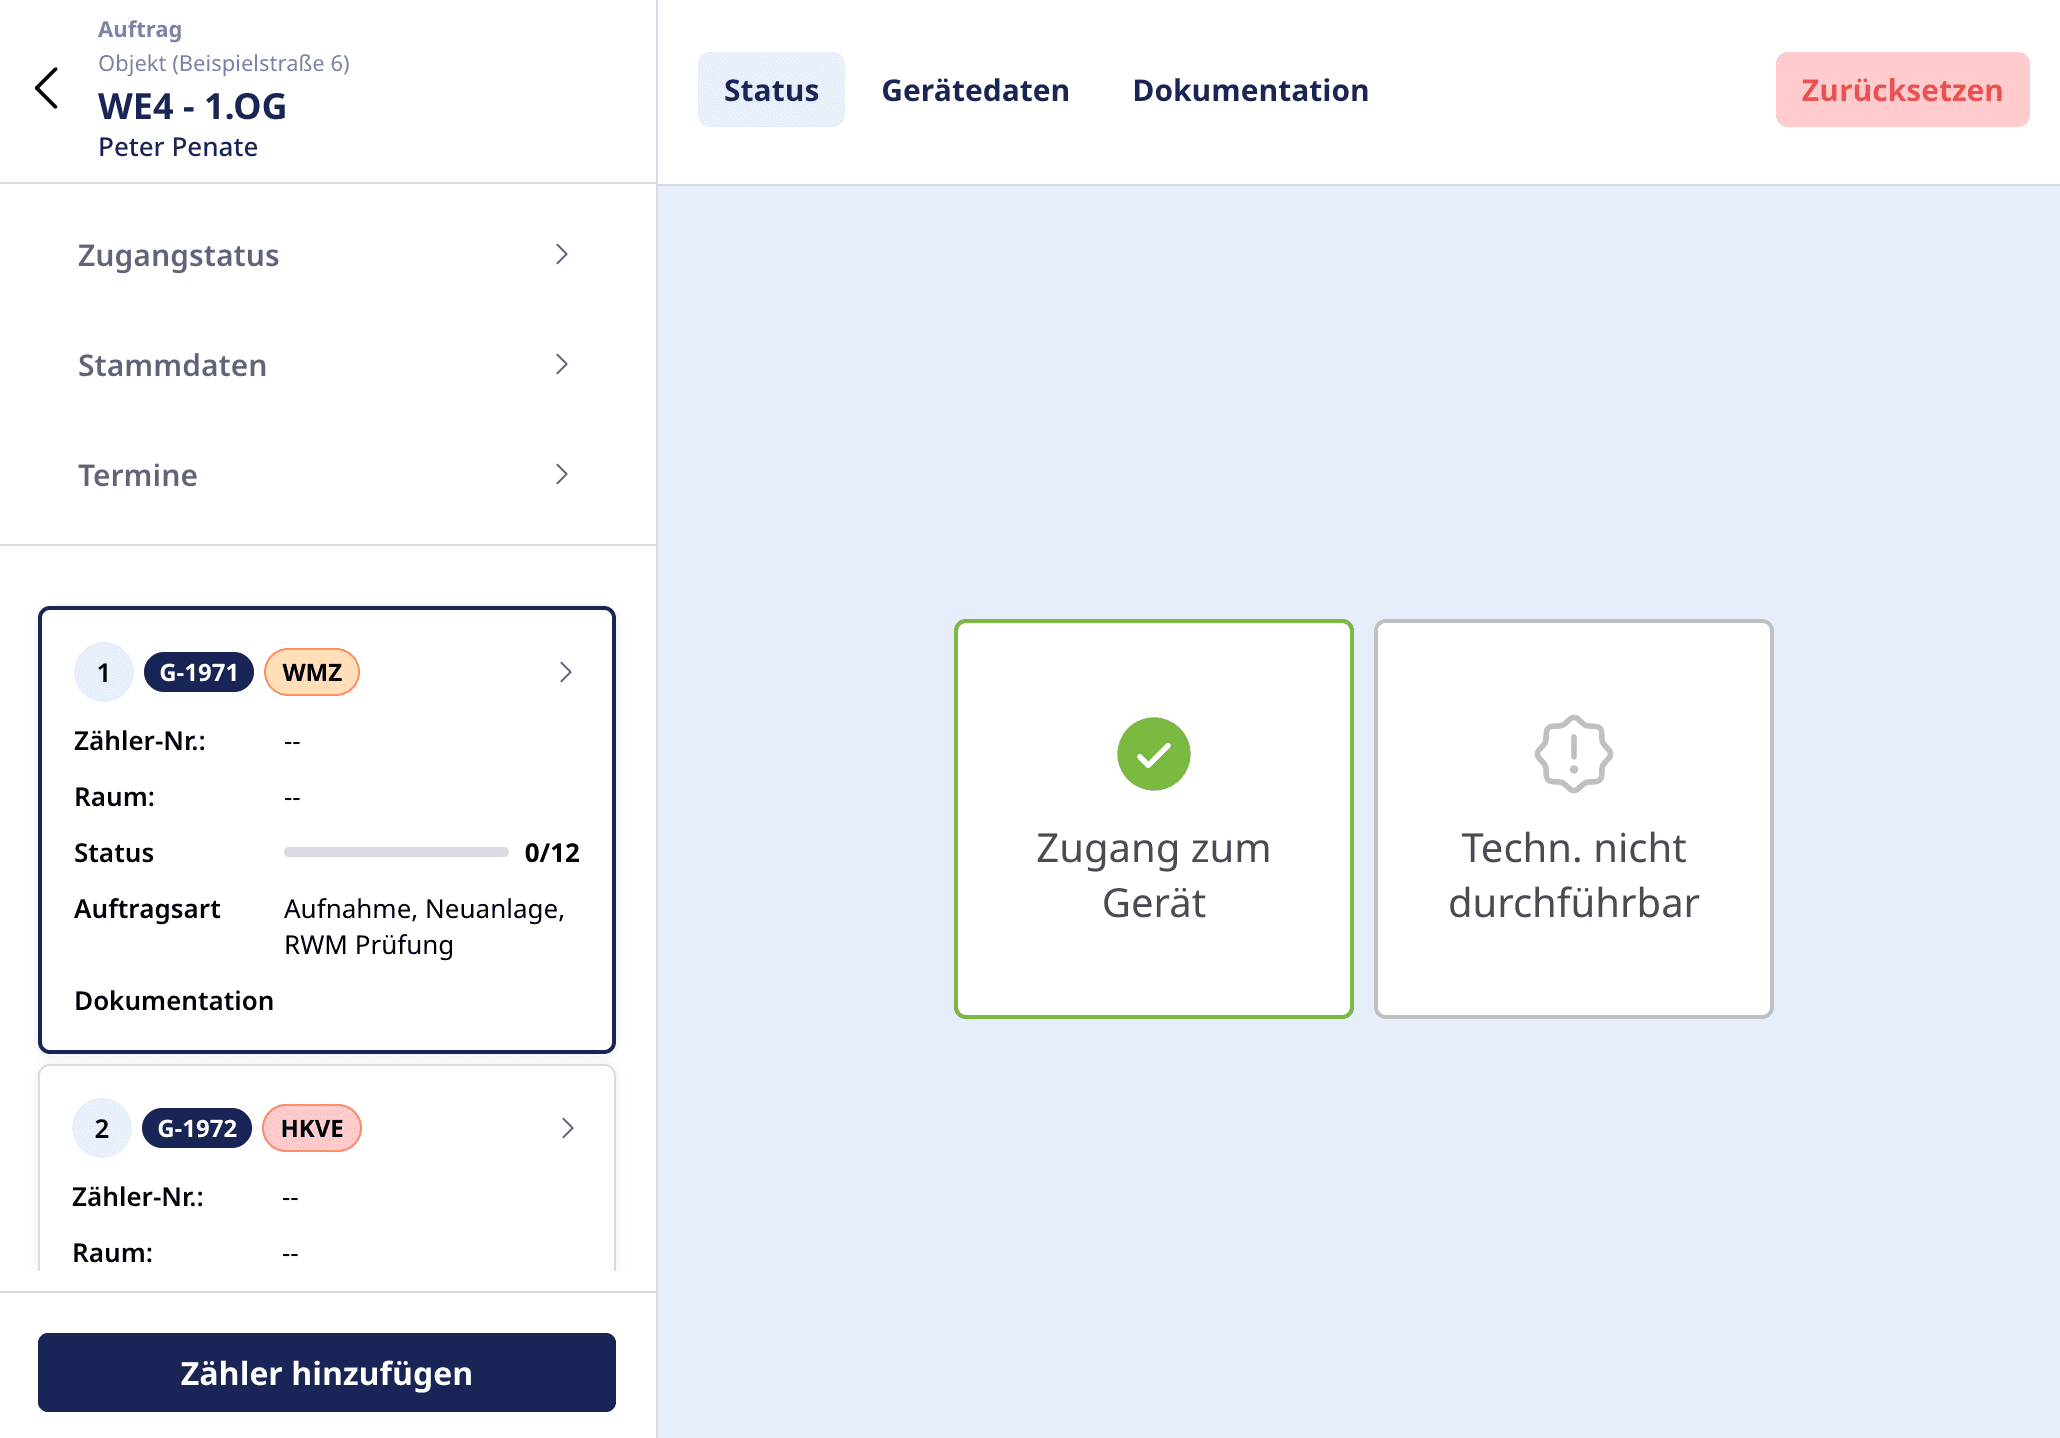
This not only makes the surface clearer – but also prevents unnecessary correction loops.
4. Tailored processes
Every organization has its own processes. With widgets, individual surfaces can be created that fit exactly to these workflows – whether for storage, service, controlling, or management.
Conclusion
Widgets get significantly more out of Ninox – not only visually but especially functionally. They help to manage processes better, present information more clearly, and make operation significantly more intuitive.
Especially with more complex requirements, the strengths of individual widgets become apparent – where standard functions reach their limits.
We develop tailored interfaces with widgets for companies that want to make more out of their database – from interactive dashboards to process assistants.
If you have an idea that you cannot implement with Ninox alone: feel free to write to us at office@arc-rider.com. 🥳